Performance Profiling
Using Logs
We provide some settings that you can activate to measure some parts of the component:
- Profile Initialization: Profile the initialization of the component
- Profile Data Preparation: Profile the preparation of data
- Profile Hit Process: Profile the hit processing
They create logs with the log category LogStats. In the following picture (Output Log of Unreal) you can see the profiling settings Profile Initialization and Profile Data Preparation in action (for 2 actors):
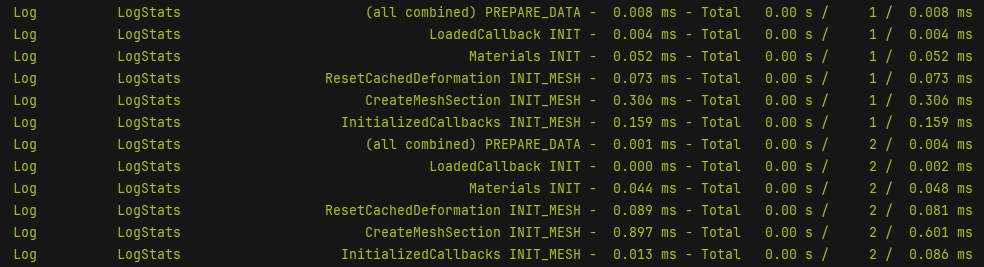
How to read the log stats
LogStats <StepName> <Phase> - <LastTime> ms - Total <TotalTime> s / <Count> / <AverageTime> ms
Using Unreal Insights
If you don't have any experience with Unreal Insights then you should get familiar with that tool first. There are several useful resources out there, this youtube video for example.
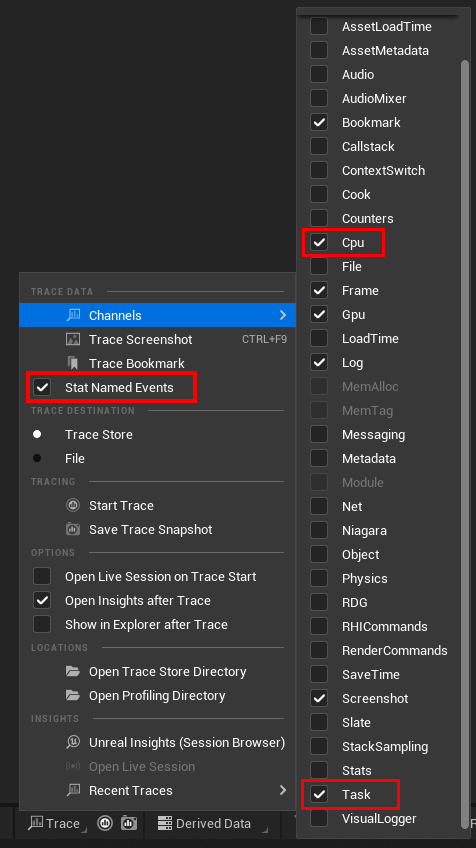
You can either start your Unreal Engine using (at least) the following start parameters or alternatively activate them at runtime (see picture):
-statnamedevents -trace=default,cpu,task
After creating a trace and opening it using Unreal Insights, you'll be presented with a similar picture:
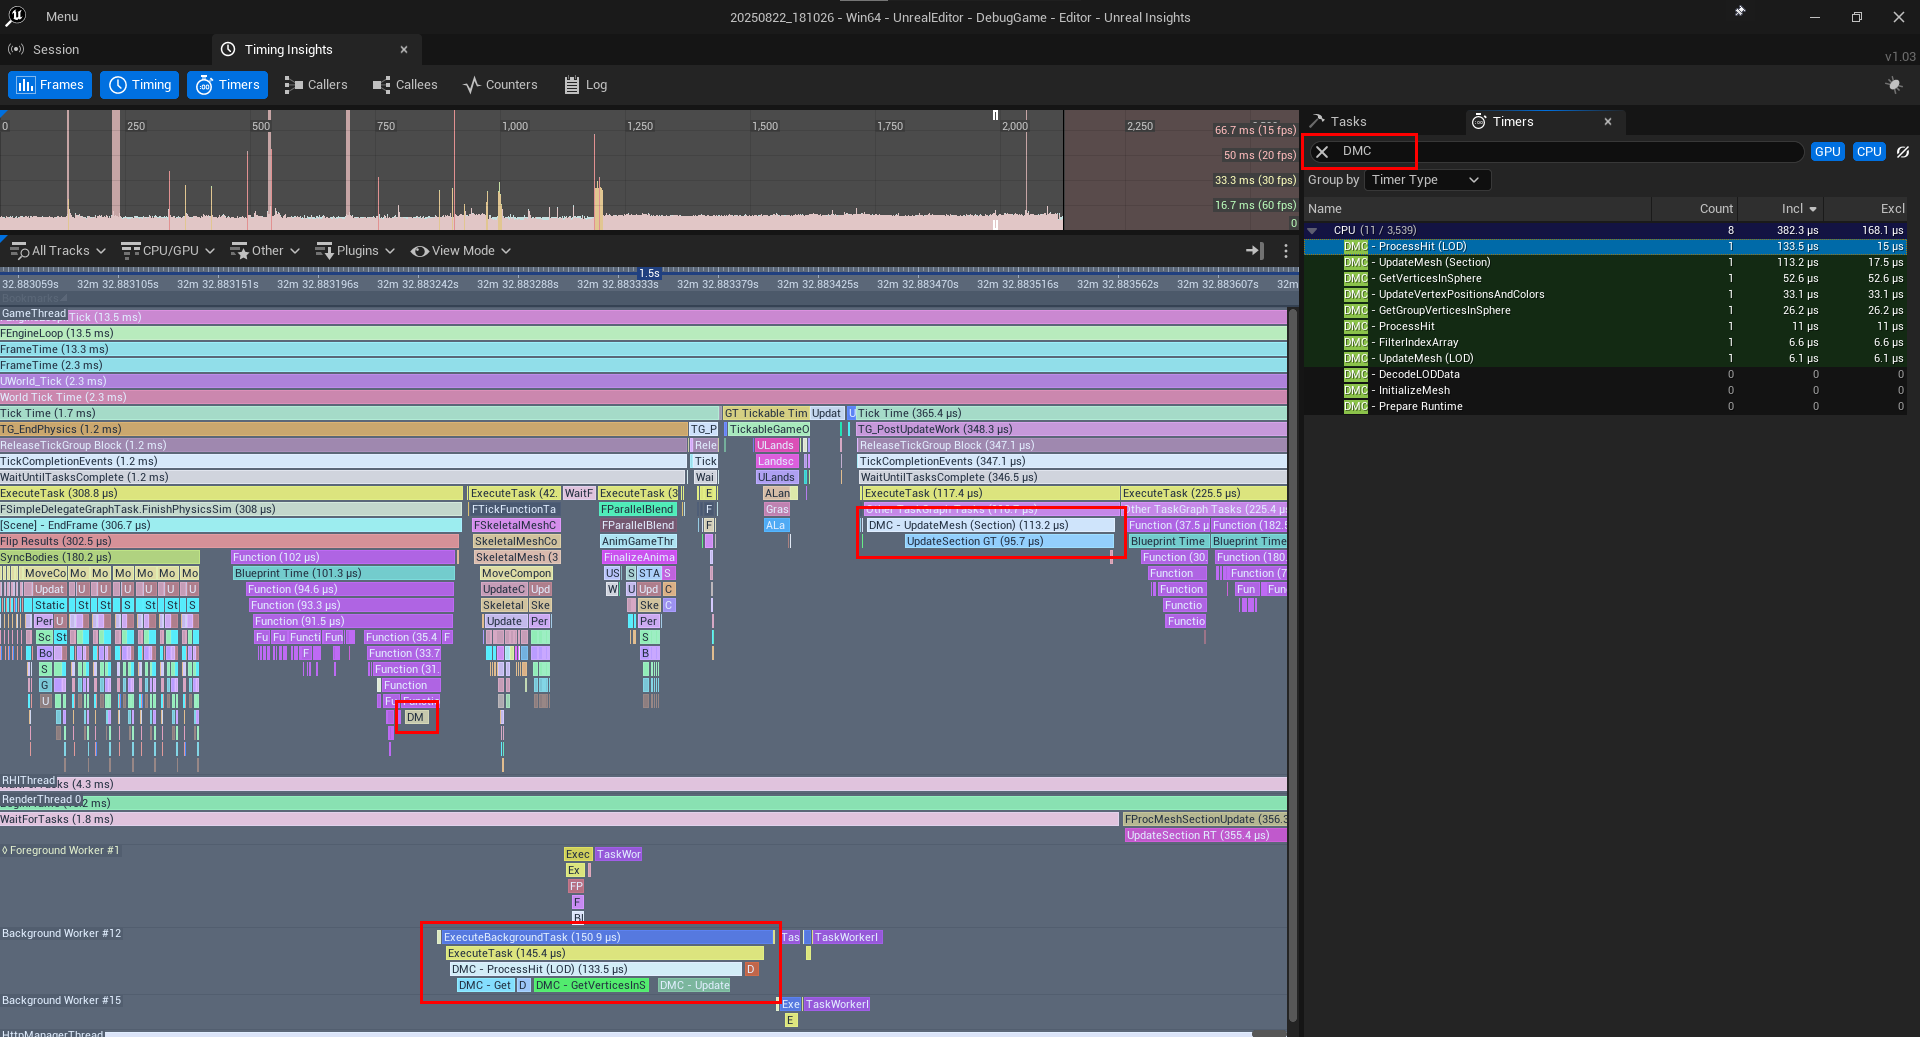
To find out how our functions perform in terms of performance, simply search for DMC (short for: Deformable Mesh Component) in the Timers tab on the right (as shown in the picture above). To find them inside the timeline (left side), you can right-click on one of the timers and choose "Highlight Event". They'll be highlighted but it may be somewhat difficult to find them, because they are partially being executed in a background thread for better performance, as you can see in the picture.